Monday, March 24, 2008
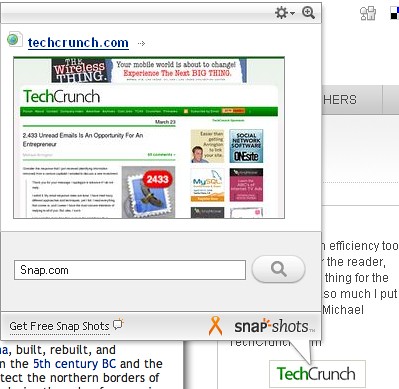
I don't like snap.com
Snap.com offers the snapshot of the linked pages. When you hover over the link which is snapshot-enabled (shown with a tiny icon), a window pops up and shows the screenshot of that page. Apparently, lot of people find it cool. I found it almost irritating. It adds unnecessary delay when all I need is the url. May be I am old fashioned since me thinks fast is way cooler than slow and just cool.


Thursday, March 13, 2008
Compressing a table in Apache Derby
If rows are deleted from the Apache Derby Database, the table doesn't get compressed automagically. You need to execute the following command with derby utility "ij".
call SYSCS_UTIL.SYSCS_COMPRESS_TABLE('SCHEMA-NAME', 'TABLE-NAME', 1)The third option is something called "sequential" which takes less memory and space, as you have guessed it, more time. But, really it is not that slow. It reduced the 1.3 G table to 600M in less than a minute. More gyaan on the man page.Labels: cleanup, compress, derby
HTTP Request Response Debugging
LiveHttpHeaders is a nifty utility (Firefox extension, actually) to monitor the HTTP request and responses. It is useful to debug or analyze HTTP request and responses. There are other commercial tools available which are, well, not-free, IE-specific and worst, unstable. Thanks Daniel Savard.
Labels: http debug
Friday, March 07, 2008
DB query tip
Hit a performance problem with Apache derby, which turned out not to be Derby specific problem anyway. The tip that the day is avoiding queries which incur entire table scan:
For Derby, the table is called "huge" if it has more than few thousand rows. (It's an embedded database.)
To debug derby performance, set the properties given below and watch derby.log
Also, realized that
SELECT DISTINCT nonIndexedCol FROM HugeTable;

SELECT * FROM HugeTable ORDER BY nonIndexedColumn;
For Derby, the table is called "huge" if it has more than few thousand rows. (It's an embedded database.)
To debug derby performance, set the properties given below and watch derby.log
System.setProperty("derby.language.logQueryPlan", "true");
System.setProperty("derby.language.logStatementText", "true");
Also, realized that
- Performance problems are more like 50-1 rather than 80-20. That is, 1% effort gives 50% result.
- Logging messages and measuring delay at macro level is easier than running a profile.
Subscribe to Comments [Atom]